The Data Frame
The fundamental data structure used by the majority of R functions and packages is the data frame. In a data frame, sets of related values constitute rows, while an individual column vector in a data frame contains comparable measures that can be summed, averaged, or subjected to any number of numerical manipulations. At first glance, a data frame seems much like a table, but the parallel breaks down as soon as we look a little closer.
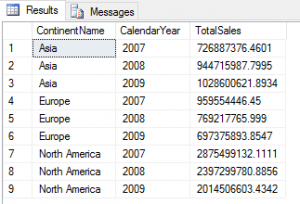
Above we see a rowset generated by a conventional SELECT statement in the Management Studio. (The data are from the ContosoRetailDW sample database.) While we could calculate the total for, say, 2009 from this rowset using R, it would not be straightforward. Similarly, we could not calculate a sum for Asia without jumping through some data hoops. What we need is a resultset something like this:
Such a resultset is referred to as a crosstab or pivot.
Of course, we could create a view in the SQL database that provides the data pivoted as desired and use the view to import the data into PowerBI. The necessary SQL can be written using either the classic CASE statement method or the newer PIVOT operator. (If you are curious, examples of SQL pivots are provided here.) Unfortunately, this technique has several drawbacks; the most notable is that each different pivot requires writing a new query. In addition, the SQL methods become more cumbersome if there are a large number of values to be pivoted to columns. We might, for instance, want to pivot 67 stock symbols instead of three calendar year. Fortunately, Power Query provides a straightforward means of accomplishing such tasks with little effort.
Pivoting In Power Query
We'll start with a slightly larger resultset than the one shown above. An example view was created that returns 1058 rows representing the sales totals by product subcategory for each of 34 countries. A view was chosen to get rid of some pesky ampersands in subcategory names that would only serve to upset Power Query. (The SQL for the view is available here.)
We start by importing data into Power BI. We will write a query rather than simply import the data from the view directly, because we want the countries to be in alphabetical order. It's a bit of planning ahead; we could easily sort the country names in alphabetical order if they were going to remain in in rows, but since we intend to turn the country names into columns, it's easiest if we sort them straightaway.
After clicking OK, we see the preview, but choose to "Edit" rather than immediately load the data.
Clicking Edit brings us to the Query Editor.
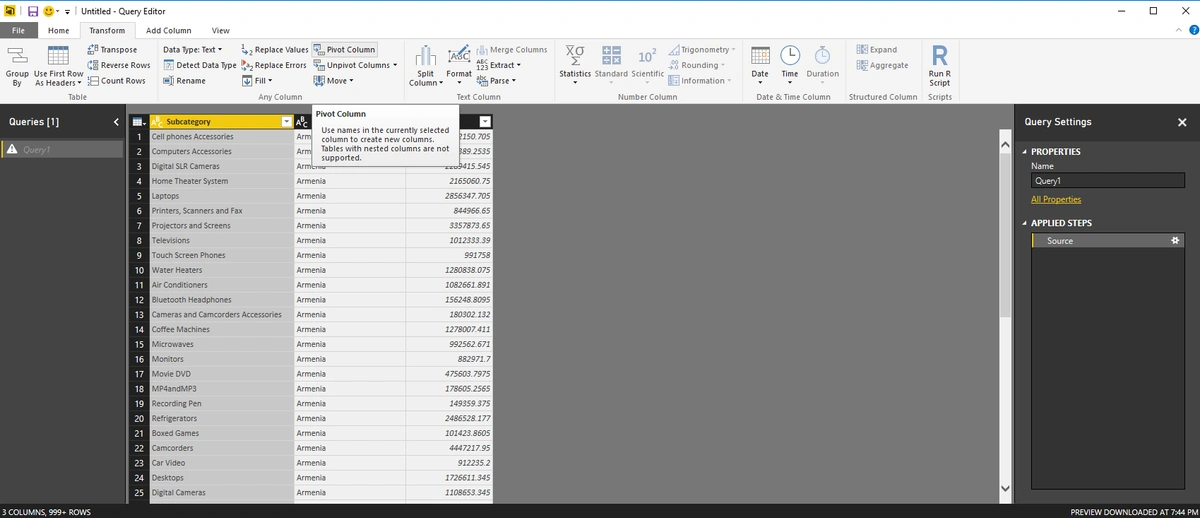
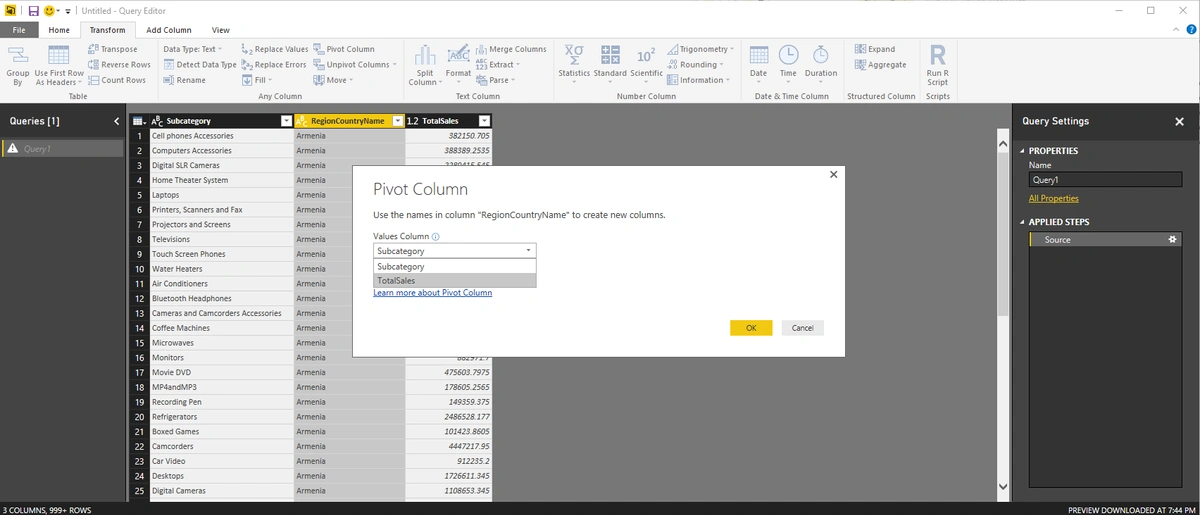
When Power Query first appeared, pivoting was available only through the Power Query Formula Language (colloquially known as "M"). Now, however, there is a Pivot Column menu choice on the Transform tab. You must highlight the column containing the data you would like to pivot before you click on the Pivot Column button, as implied by the tootip. When you click on the button, Power Query will make note of which column is highlighted and give you the opportunity to select which of the remaining columns will provide the displayed values.
In this example, we specify "TotalSales" as the values column.
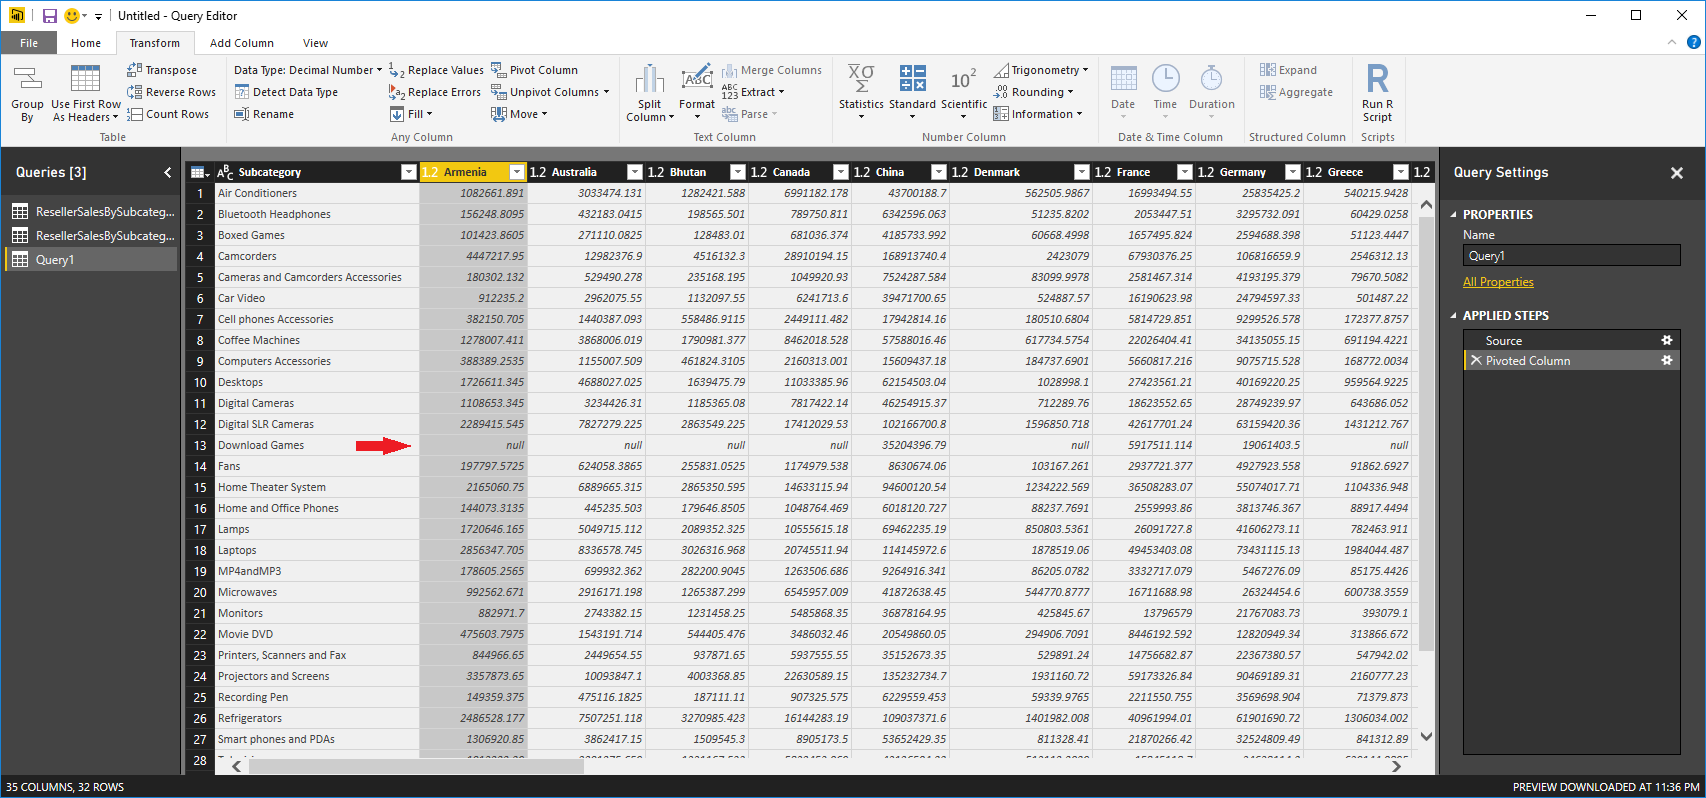
After we click "OK", we see a potential problem in the data preview.
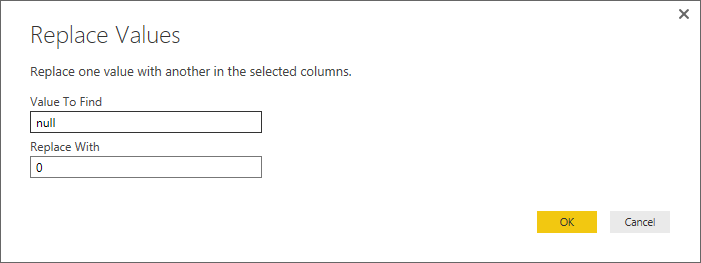
There are some cells that contain "null". This is unacceptable to many of the statistical algorithms we may ultimately wish to apply. It is important to note that these nulls are not present in the SQL resultset and cannot be eliminated using T-SQL functions such as ISNULL or COALESCE. No, these nulls appear in our pivoted data because there are combinations of subcategory and country that simply do not appear in any row in the original resultset. Once again, Power Query provides an easy solution. We simply highlight all the country columns and then click Replace Values, also on the Transform tab.
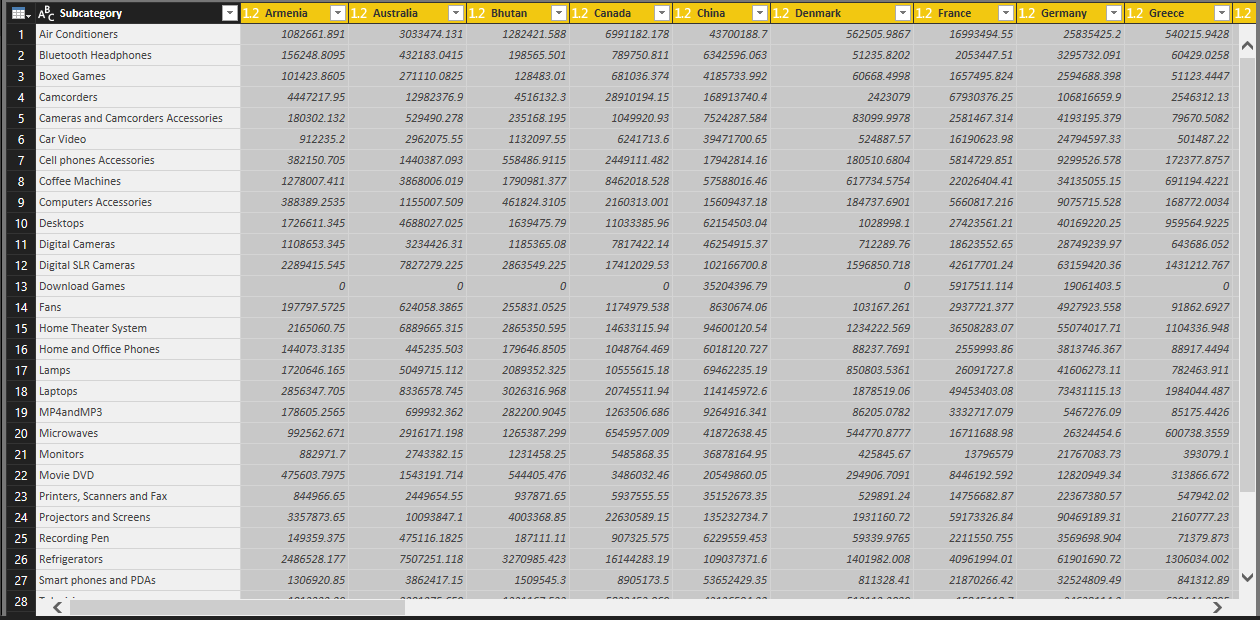
Now we have our final query. A resultset any R data frame would be proud to call its own.
Conclusion
Power BI is taking its place alongside Microsoft Excel as one of the predominant workhorses of business intelligence, analytics, and data visualization. Power Query is integral to both and can be indispensable for bringing data into the correct form for detailed examination.
Related Training:
Business Intelligence
Microsoft Office


